The UpTime Report is a summary of the data services provided by the SNIP Caster and is expressed in terms of the total data served and user connections serviced since the last restart. The values are a summary of all users and all data streams.
Aside: Individual data counts for NTRIP Client users and for various types of data streams can be obtained in other reports.
Here are three representative UpTime reports, taken from some of the SNIP public service machines.

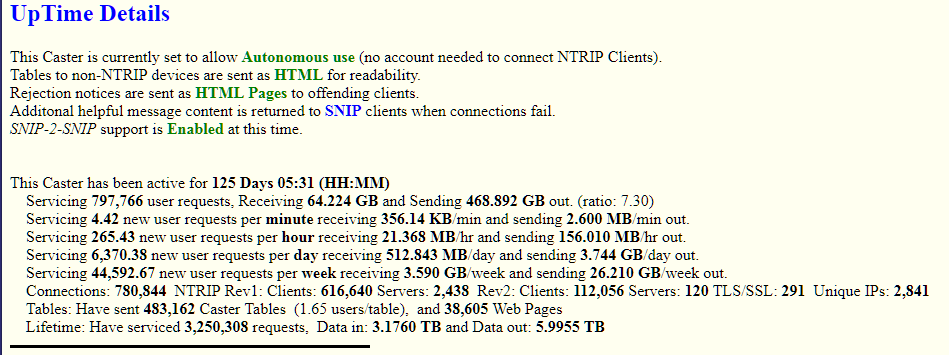
The report is from a stable machine with 30+ Base Stations servicing new SNIP users with representative data for their evaluation. The user connections here are generally well behaved with just over 250 new connections every hour averaged over the past 125+ days. [An average of 44.5k connections per week] The Caster is sending out data at a rate of 7x the rate data come in.
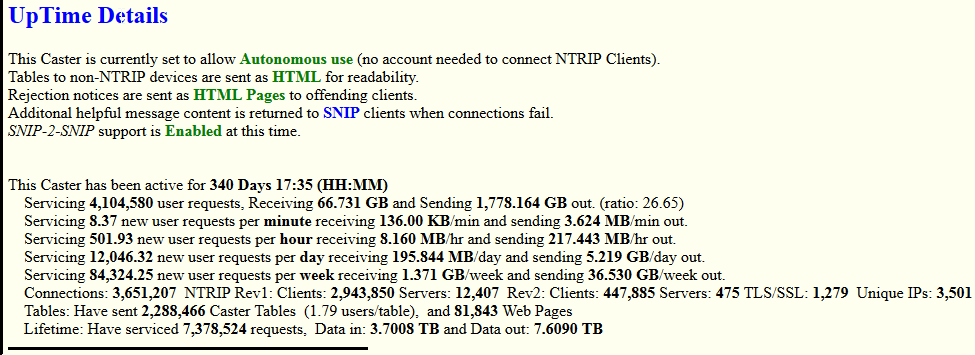
Here is the same caster, with the same report, but taken 200+ days later.

And to compare further, a report from another machine…

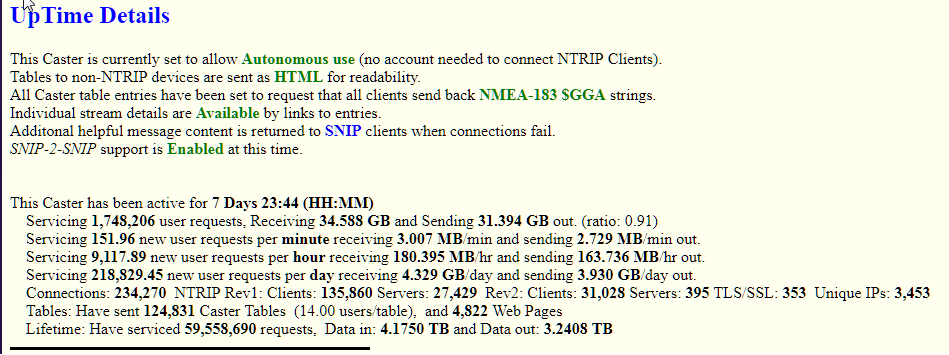
This report is from a very active machine with 200+ different Base Stations at any given time and constant connections from different users all over the world. This report is from the www.RTK2go.com public caster where many of the new users mis-configure their NTRIP software and hence cause an extra traffic load. In this report we can see that over the prior week, there have been an average of 2½ new connections made each and every second of the day. [An average of 1.5 million connections per week] The Caster is sending out data at a rate of 0.9 the rate data come in.
Management Tip:
Use the Uptime report along with the reports provided by the various System Log reports to understand how your SNIP NTRIP Caster is being used by others and various processing demand placed on it.
Requesting the Report
This report can be obtained in several ways as shown in the table below. Because it is also part of the STATUS command, it is less common to request this data as a stand-alone report. However, some deployments with in-house programming skills have used this command as simple way to “ping” their Caster.
| Web Command: | /SNIP::UPTIME [Feature release now pending, rev 2.05] |
| Doc Command: | None, use STATUS button in viewer toolbar |
| SNIP Window: | Menu: Reports -> Network Traffic -> UpTime Report |
| Details: | This report is appended in other reports as well. |
This feature can be disabled by UN-checking the buttons “Web Page Integration” and “Show Main Status Page” in the Preferences dialog. The Preferences dialog is found under the Edit menu item.
Monitoring 24/7
Hint: If you are not using the SNIP build-in status monitoring system to report when your Caster experiences any problems, you may want have a 3rd party ping service request this page every few minutes.
[The SNIP build-in status monitoring is in early testing at this time (1Qtr 2019). Interested licensed users can send a email to support[a]use-snip.com if they wish to be part of the testing for this feature.]
