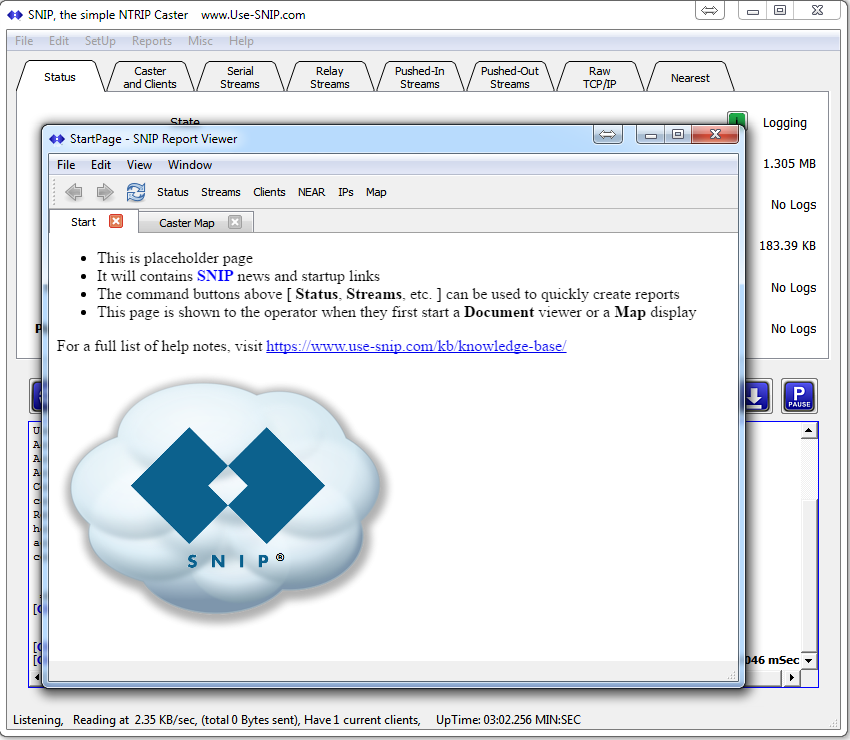
The Document Viewer window is used to display
- Large reports,
- Images, and
- Geographical maps of casters and user.
It replaces the system used in Rev 1.0 of SNIP where all report style information was always placed into the console log. An exception was the display of small maps in their own window.
Because of the extensive hyperlink support, many of the common status monitor needs of the SNIP operator can be handled from within this window. For example, one can easily click links between the general status of all the Base Stations, to specific Rovers (users) or specific connected IP addresses (bases and rovers).
When SNIP is started, this window is created, and (like the main SNIP window) it retains the position and size you set for it. It is never destroyed, but simply hidden (individual tabs can be destroyed). As a best practice, expand the window to a suitable size for your own preferences. SNIP will bring it to the foreground when required.
The Document Viewer window is modeled as a browser, and in fact is build on the chromium engine which is used by Qt as the default. Each tab lives in its own memory and threading model so the SNIP real time response remains isolated from it.
The initial start page /tab is used as a simple news channel to inform the operators regarding new developments and releases of SNIP. When the user has run SNIP less than 25 times, some additional quick start pages are also shown to assist the new operator to help with initial setup questions.
At the top of the window you will see a dock-able tool bar with several additional small buttons. These represent the most common report types. Pressing each will create a report of that type in its own tab. If such a report is open, it will switch to that tab and refresh it with the most current data. Various reports can also be requested from the Reports menu on the main window.

The back, forward, and reload buttons work as one would expect with any browser. A summary of the SNIP unique buttons (outlined in red above) follows. [Not shown; Rev3 editions of SNIP also added a Print and and an eMail button to the above tool bar. This allows you to send a report to others.]
The Status Button
This button provides a general summary of the Caster state. It lists both the current and past MountPts (data streams) as well as several other key values about the state of operations. Additional buttons in the report provide links to further details.
This report can also be obtained as a web page by any remote user by requesting the mountPt “SNIP::STATUS” – if the SNIP operator has enabled the check box marked: Show Main Status Page in the preferences dialog (accessed from the menu: Edit -> Preferences).
The Streams Report
This button provides a summary of all the mountPts found on the Caster. It augments the List MountPts button found on several of the tabs, but places the report into a tab in the Document Viewer window, not the console.
The Clients Report
This button provides a summary of the Clients connected the Caster.
The NEAR Report
This button provides a summary of the current NEAR streams including their pool members and the clients which are connected to them.
The IPs Report
This button provides a summary of the different IP addresses that have been used to access your Caster. The mountPt request and the connection times are also shown, as well as the NTRIP Agent. If more than one Agent is used, each is listed. Summaries of any NMEA $GGA sentences are also shown as well as the last reported position. A Geographic Reverse IP look-up report is also provided.
The Map Report
This button provides a general map showing the location of all Base Stations (all stream types) and all Clients (NTRIP Clients or rovers), as well as other details.
The Process Report
This button provides a snapshot summary of the resources (memory allocations, disk space, MIPs) used by SNIP on the Host machine. It is of general value when testing or debugging to ensure that SNIP is able to get machine resources without delays. [This report was added in Revision 2.13.00]

