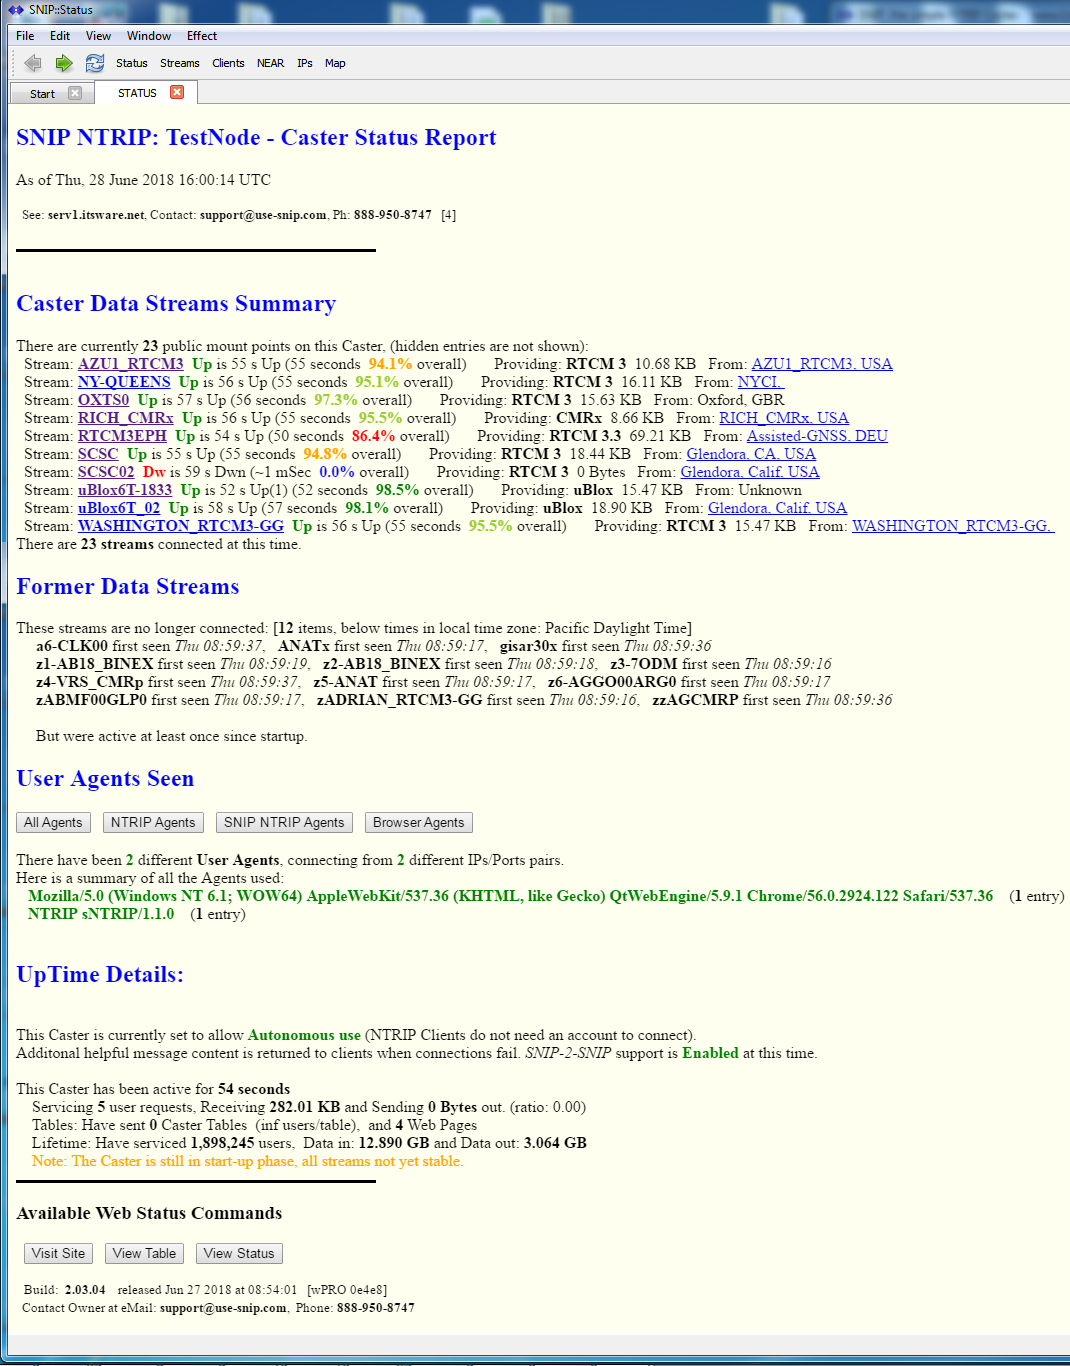
The Status Report provides a general summary of the SNIP Caster state. It lists both the current and past MountPts (data streams) as well as several other key values about the state of operations. The report is organized along the lines of a Caster table but with more readable data content which list how long each connection has operated since any prior data interruption.
Hint: If you use a 3rd party monitoring service, you may wish to tell the remote robot to check this page, if it requires a specific page to use for periodic downloading.
There are additional buttons/links in the report that provide further details including
- Details about any current mountPt (if enabled by operator) including equipment and message contents, see this article for details.
- A display of the map location for each mountPt, based on it ECEF message values, see this article for details.
- A list of former mountPts (data streams) that are not longer present on the Caster (useful for debugging by data providers)
- A list of the different NTRIP User Agents that have connected. Additional buttons allow filtering this list, see this article for details.
Near the bottom of the report is a status summery of the SNIP operations since your node was last started, see this article for details.
At the top of the report is a time stamp and contact detail (based on your preferences settings) for your NTRIP Client Users to see. At the bottom of the report (when used on public web pages) is a common section with links to:
- A home link page for your form web site
- The raw Caster Table, in its styled web page format
- A “status” but that simply refreshing the current page.
The typical status report can become quite long. Try this link to see the current details for the public RTK2go.com Caster for an example of this, shown in a web browser. Here is a terse but typical example from a SNIP Caster that has just been restarted, shown in SNIP‘s document view:
Requesting the Report
This report can be obtained in several ways as shown in the table below.
| Web Command: | /SNIP::STATUS |
| Doc Command: | STATUS button in viewer toolbar |
| SNIP Window: | Menu: Reports -> Network Traffic -> General Status Report |
| Details: | Private data is not shown on public web pages unless admin is used in request. |
Additional display details such as end user IPs are only displayed to administrators, and not on the public facing web pages. This feature can be disabled by UN-checking the buttons “Web Page Integration” and “Show Main Status Page” in the Preferences dialog. The display of additional details about each active mountPts can be disabled by UN-checking the box “Per-Stream Status Links” in the Preferences dialog. The Preferences dialog is found under the Edit menu item.

