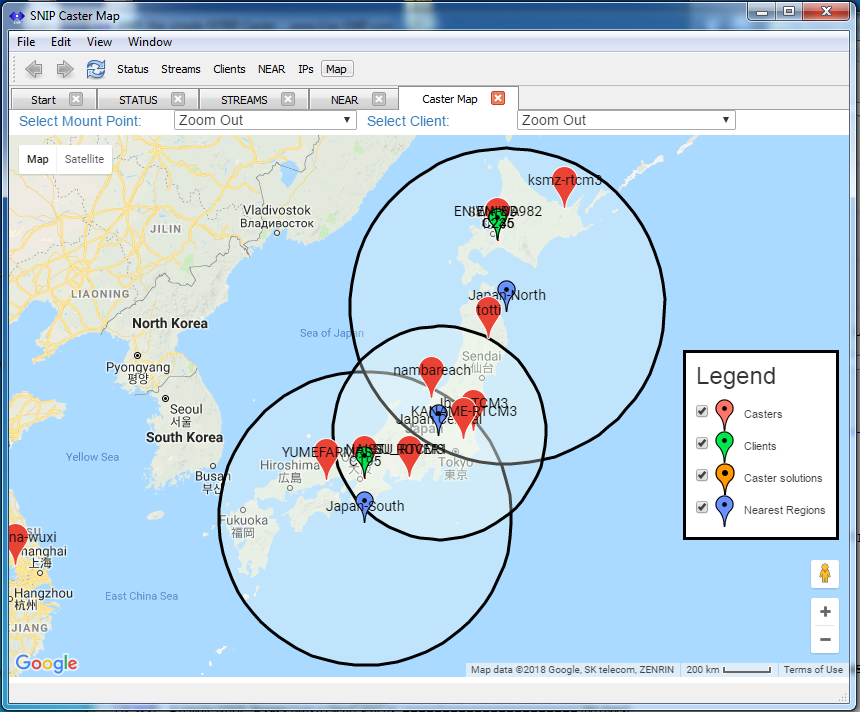
The MAP report provides a graphical summary of all the Base Station locations, as well as those NTRIP Clients that report their locations with NMEA $GGA sentences.
The general look and feel is similar to other maps displays found in SNIP.
This MAP display all the Data Sources (Base Stations, or NTRIP Servers) and the those Connected Users (NTRIP Clients) that send $GGA sentences, as well as NEARest streams and their coverage regions. Other MAPs can be invoked which will be centered on specific Base Stations or Users. Because a MAP displaying User locations is considered a security risk, user locations in this report are only available in the document viewer (not over Web pages).
In the below example map, there are multiple NEAR streams and the Base Station that were present when the image was captured. These are shown along with the boundary distances for three NEARest streams. [Click to enlarge image.]
Requesting the Report
This report can be obtained in several ways as shown in the table below.
| Web Command: | None, a master map is not available on the pubic web pages. Individual MountPts can be mapped from the general STATUS page. |
| Doc Command: | MAP button in viewer toolbar |
| SNIP Window: | Menu: Reports -> Item: Map View ... |
| Details: | A right-click on any data stream also provides the command "View on Map..." |
This is one of many map views provided. Each Base Station data stream can also shown in its own map by right-clicking on its context menu. With the map view, the two drop-down combos can also be used to center the map on various places such as connected Users and Base Stations.
Hint: Want to plot all the reported Base Station Locations of any public NTRIP Caster anywhere in the world, not just SNIP?
Use our (free) cloud based monitoring tools at the below link. Enter the Caster URL and Port. The Caster Table will be returned and displayed in a readable format. You can plot individual mountPts, or the entire table with the buttons along the far right-hand side.

