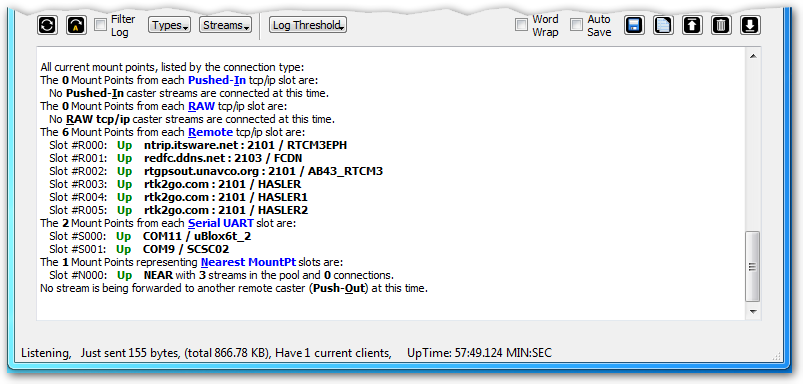
Along the lower half of the application window, below the set of control tabs, is a scrolling textual display called the console log. Several controls provide the means to control what level of detail is shown. Below that, at the bottom of the application window, is a status display line.

The above image shows a typical fragment of a report from the console. The user has just pressed the List Mount Point button and a report of the active mountPts from all stream types has been appended to the log. If any of the remote relay caster connections were down, this would also be shown.
Small Icons
The console log employs a set of small icons with each entry to quickly show the type of connection the entry pertains to. This is helpful to disambiguate the entries when the same MountPt name is used in different contexts. Consider a base station called “xxx” which arrives to the Caster with a PUSH_In connection, is sent out of the Caster to another Caster with a PUSH_Out connection, and is then connected to be one or more NTRIP Client devices. Without these symbols it is harder to discern which connection is being described. This symbol is added when the console is reporting details about the stream or its connection. The symbol is not used when reporting about a connected user (rover or NTRIP Client) and that stream.
These six small symbols are used:
↑ The Data is from Remote-Relay connection
← The Data is from PUSH-In connection
→ The Data is from PUSH-Out connection
⇐ The Data is from RAW TCP/IP connection
↓ The Data is from Serial UART connection
⇒ The Data is from a NEAR pool
The symbol is not used when reporting about a connected user (a rover or NTRIP Client) for each stream. Here is an typical example where three Remote-Relay connection events are being described.
[SCSC↑]:  Stream analysis completed... Parsing is Enabled for one format.   [Detected RTCM3, Decoded: RTCM3]
[Demo1↑]: Stream analysis completed... Parsing is Enabled for one format.   [Detected RTCM3, Decoded: RTCM3]
[Demo2↑]: Stream analysis completed... Parsing is Enabled for one format.   [Detected RTCM3, Decoded: RTCM3]
Labeling Style
The console supports a number of different labeling styles. These can be quickly selected from the button Types and the menu Toggle the Label Style Used. Each time the menu is selected the style changes. There is a rotation of several styles to select from. The different items in the list below are enabled and disabled to create the final label heading to be used.
- Stream Name, e.g. [SCSC] – with the small icon added as per above
- Slot Type and Number, e.g. [R001]
- Day of Week and Time, e.g. [Thu 09:46:27] – second precision, localized Day of week (DOW)
- The Precise Day of Week and Time, e.g. [Thu 09:46:27.023] — mSec precision from Host machine clock
- Full Date and Time, e.g. [Aug 06 Thu 09:46:27] – second precision, MM DD DOW order
- Full Date and Time, e.g. [06 Aug Thu 09:46:27] – second precision, DD MM DOW order
- Full Date and Time, e.g. [Thu 06-08-2020 09:47:27] – second precision, DOW DD MM YYYY order
- Full Date and Time, e.g. [2020-08-06 Thu 09:46:27] – second precision, YYYY MM DD DOW order
- The console entry number, e.g. #010121 – a unique monotonic value for every entry
Because all recent console logs are re-drawn whenever the style is changes, this feature can be quite useful when you need to determine the precise time at which a prior event occurred.
Hints for busy Caster Logs
A Caster can have new NTRIP Client connections and other events occurring every second, making the console log hard to read at times. Use of the Pause, Scroll Down, and Clear buttons on the right side make short work of any log clutter. Longer reports are sent to the document viewer to avoid this issue. The last ~5,000 log entries are always kept and can be replayed at any time by using the two Refresh buttons located on the left side.

Key Hint: When the Caster window is moving too fast, just press the Pause button.
Pro model, the Event Summary Windows
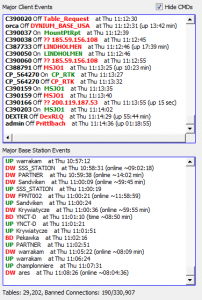
 On Pro models of SNIP (as well as on Evaluation models), two additional windows are also shown (when the option is checked). These windows provide a summary view of recent events. Events concerning NTRIP Clients (rovers) are shown in the upper window, while events concerning NTRIP Servers (Base Stations) are shown below.
When a Caster has new connection events occurring at rates exceeding a few seconds or more, the amount of text in the console can scroll faster than the eye can follow (use the Pause button as needed).
The purpose of these windows is to provide a quick summary view of more major events. And, when a new connection is repeating with the same results, these entries are bundled together in the display. In the window at right (click to enlarge) you can see summary views of Clients and Base Stations connecting and disconnecting.
A label (at the bottom of the window) shows the number of Caster Tables served as well as the number of current connection attempts that were rejected from blocked IPs.
Use
The Console is used for general purpose logging of all events in SNIP. The log records a linear time stamped sequence of the various connection and data serving events that occur in SNIP.
The log entries often provide more detailed data than is needed when not performing analysis is a problem, and can easily become overwhelming. A set of controls above the log display allows simple basic filtering operations on the log, useful to reduce the entries displayed to a more manageable level.
See this article for further details on how to manage what items are displayed.
See this article for further details on how to capture the console log entries to a file for further use
See this article for advice on how to capture a log to be sent to us for technical assistance from our support team at support [at] use-snip.com

