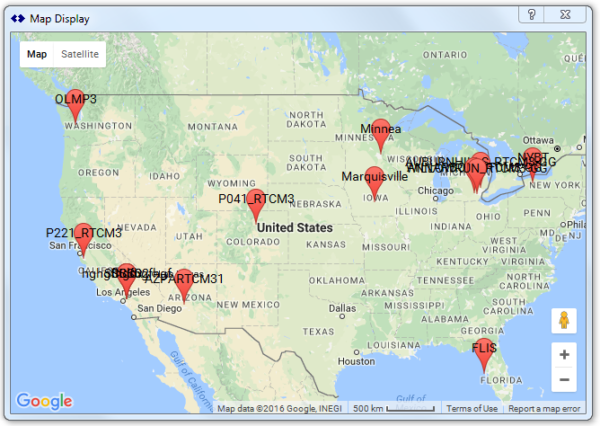
SNIP provides a basic mapping function to visualize the location of both the Base Stations in its network and the connected NTRIP Clients it is servicing.
A new map can be invoked from many of the right-click menus (such as the menu for each Base Station slot) or from the main menu (under Reports ⇒ Map View…). Several of the dialogs also have a map button. All maps are displayed in the general Document Viewer window.
Similar to the basic functions found in BNC and RTKLIB and other such tools, the ability to display your current set of mountPts on a GIS base map is added using a 3rd party base map (using the common Google Map API).
 The position data which is used for these maps is worthy of some further explanation.
As a rule SNIP gets the position which is used for the Base Station data sources from three sources:
- The value in the Caster Table location, a Lat-Long with 0.01 degrees (~500 meters) of precision, or
- The actual ECEF position which is sent in the RTCM3 messages, with 0.0001 meters of precision, if the data stream is a RTCM3.x format and the stream itself is being parsed.
- A very gross location based on the IP used to connect to SNIP.
The ECEF based position is preferred when it can be obtained – as it is more often correct. [But we have seen errors due to incorrect data there as well]
And SNIP gets the position which is used for the NTRIP Client position from the NMEA-183 $GPGGA sentences they send back. Not all Clients will send this data. When no other data is available the connection IP is used to provide a very gross location.
A couple of minor things can go wrong with this that you, as the operator of a public Caster, should be aware of.
- Not all Caster streams are in RTCM3.x format , in which case SNIP cannot decode their inner message content details.
- Not all Caster Tables entries tell the complete truth. Some Casters have have Longitude sign wrong. Others with VRS, do not have a value and send zero. For NEARest type mountPts, the RTCM-SC104 committee recommends sending a LL value in the center of your state or coverage area. [SNIP does this automatically with its own NEAR connections]
- Not all Caster Table entries provide a position, If you see Caster entry at 0,0 then suspect this.
- NTRIP Clients only report their position when sending back NMEA-183 $GPGGA sentences, otherwise only the connection IP that was used known. You can also tell your NTRIP Clients that you wish to have $GPGGA sentences by setting the “Always Accept NMEA-183” check box in the Preferences dialog.
- The NMEA-183 $GPGGA sentences send by many NTRIP Clients are typically not accurate to RTK levels (~2cm). This needs to be determined on a case by case basis with the NTRIP agent (the actual software that the client uses) that a given device uses.
- Some NTRIP Clients will send completely off base NMEA-183 $GPGGA sentences because they are connecting for test or research purposes, or they know that the data they send will not make any difference when connecting the single baseline stations.
At this time, the Map feature supports displaying the current SNIP Base Stations, the current NTRIP Clients, those Base Stations which are used in NEAR pools (as well as the region of the NEAR pool), and Base Stations from other remote Casters. For Base Station two radius plots are provided to indicate expected L1 and L1/L2 outer operational ranges. These maps are all provided in the context where they are needed. [For example to view the streams found on another system and it’s remote Caster Base stations, invoked the “View Map” button in the Relay-Remote dialog.]
The SNIP product road map is to add further features to this basic map as time goes on. Please tell us what you think is wanted in this regard, as user comment largely drives the SNIP feature priority list. If you require real time AVL tracking for your clients (or having this data send to a general GIS product), please take a look at the AVL tab in SNIP.
Update of Late 2016:
In November of 2016 SNIP has changed its MAP approach to use a Google provided map product as the displayed base map. There were two business reasons that motivated this change. First, the terms of service with the other product for our professional grade clients did not sufficiently protect the privacy needs of their end users (their NTRIP Client devices) as much as we felt was needed. And second, we fully expect SNIP – in its free Lite version – to become the most widely used NTRIP Caster in the history of the world. And while we depend on the sales of the other editions to make that occur, we could not accept using a map with plotting and usage limits that might restrict the free user community segment. So we switched to Google / Esri where we have some prior experience to draw on.
For the end user, the visual effect is largely the same, the precise base station locations are shown (with a right click) on a zoom-able and pan-able map of the world. We have added a small bit of “smarts” when the base station report itself as being located at zero-zero.
Update for AVL Uses:
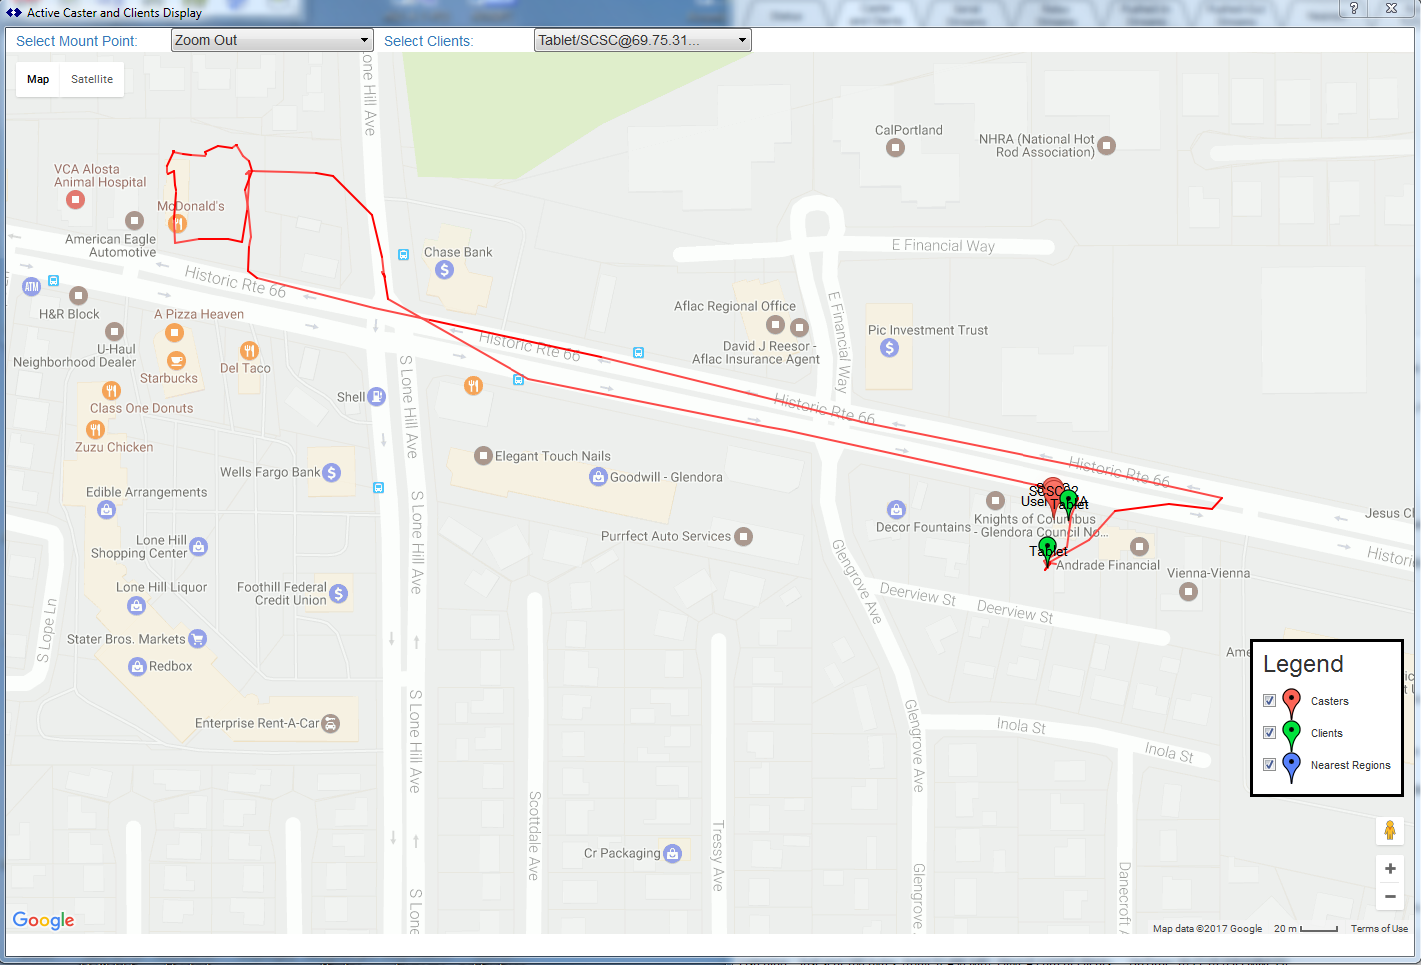
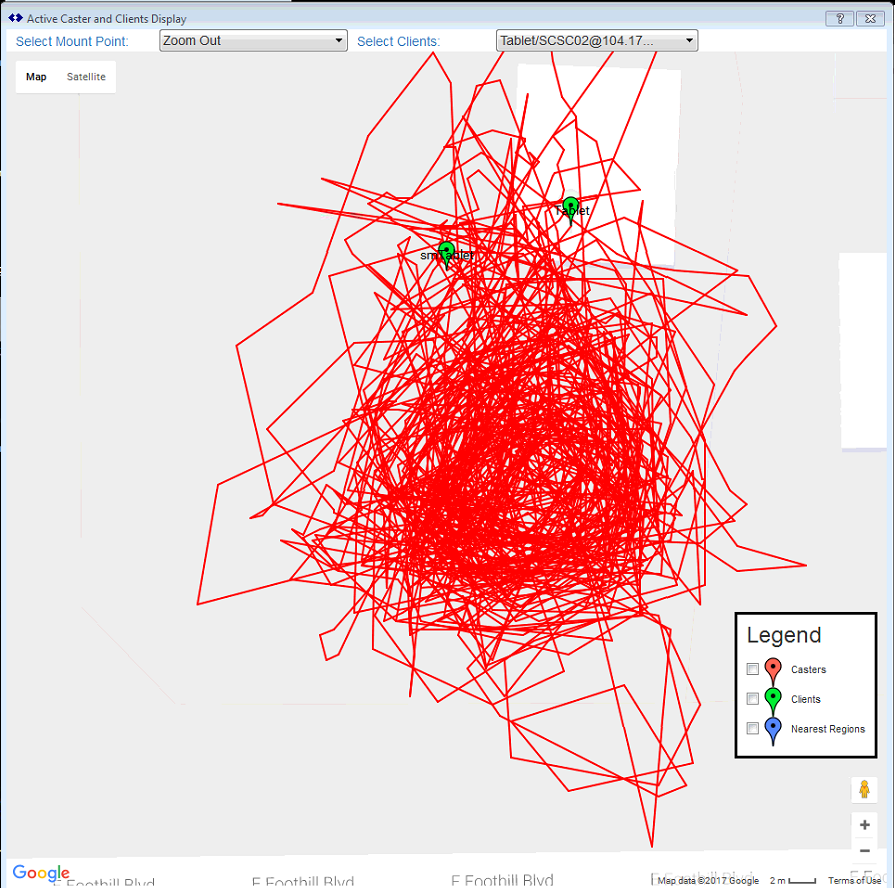 As of release 1.5.0 (March 2017) SNIP has changed the way NTRIP Clients (rovers) are plotted to now show their recent reported position as tracks on the map. Now these maps are updated at a ½Hz rate as new NMEA-183 GGA sentences are obtained. Often NMEA-183 GGA sentences are only sent at slower rates (once every 5, 10, 30 seconds etc.).
As a trivial example of this, here is a client device can walking in circles using the popular Lefebure NTRIP Client on a android tablet using its built-in GNSS to produce the image on the right.
Update for Clustering
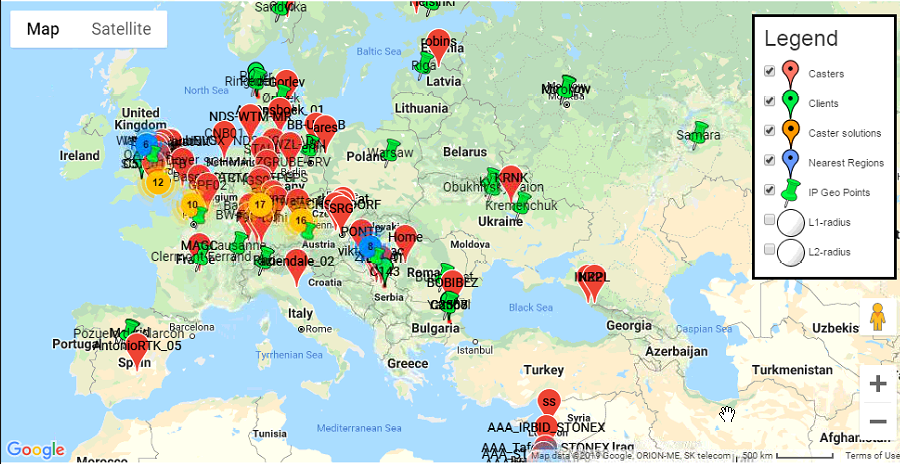
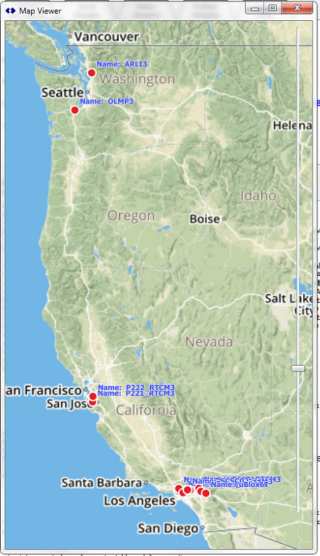
As of release 2.08 (February 2019) the maps in SNIP now use a clustering style to display the various data points when there are many closely spaced points involved. As the user zooms in, the individual data points are displayed. This this article for more details. Here is an image taken from the RTK2go.com open caster showing this style in use.
Showing NTRIP Clients:
The map also has the ability to display the current NTRIP client connections as well. This allows a simple visual view of the reported locations of those clients which send in NMEA-183 GGA sentences to SNIP. NTRIP clients which do not send NMEA sentences are plotted at the zero,zero location. NTRIP clients are plotted (in a green icon) along with the Base Station in the general map view.
To invoke: In the menu Control, select the menu item Map View…
Plotting NTRIP client connections based only on the connection IP used (at best only a rough positional estimate) but is also in work at this time. However, IP mapping can only serve as a rough value of user position, and is often incorrect to many miles/km. Also; the weekly logs are also being revised to allow plotting historical connections over the past weeks or month as it now done with caster connection up times.
Client Tool Tips
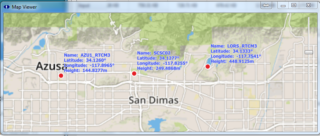
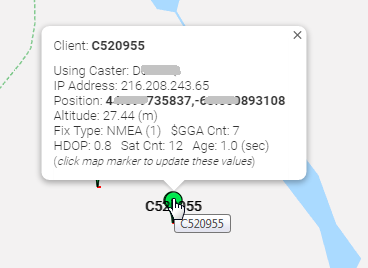
Whenever the mouse is clicked on a marker, some additional information is displayed in a tool tip about that Base Station or other object. When the mouse is clicked on a NTRIP Client this information also includes information about the last reported NMEA-183 $GGA string as shown below. This is useful when debugging connections with your connected users. In the below you can see the user has a good HDOP, sufficient satellites, and is receiving the RTCM corrections with low latency. All indicative of proper rover operation.
Viewing Other Caster Networks:
When set-up in a Remote-Relay stream in a dialog, there is a button that will invoke the map and display all the mountPt entries for the Caster you are connecting to.
To invoke: In the Relay Streams tab, press Add New Stream... The Add New Caster Stream dialog will appear. Enter the Host URL and port number, get the current mountPts (press the button) and then press View Map.
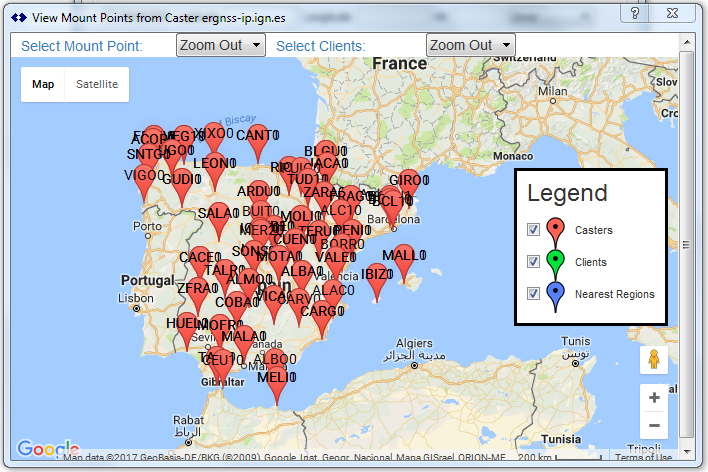
Here is an example of this use showing the regional CORS network covering Spain, which is available from ergnss-ip.ign.es:2101
Using the Monitor.Use-SNIP.com tool
The above maps are all created and drawn locally by the copy of SNIP operating on your desktop. The base maps are served to your machine by Google, using a secure internet connection. If you want to check your own machine (or another node) from “outside” your own network, we provide a tool for that need.
SNIP provides another way to display caster maps; using its cloud based Monitor tool, which you can find at: monitor.use-snip.com. This tool allows checking/displaying a public Caster Table by entering the URL or IP (and port number) it is at. The returned Caster Table is then displayed in a table format with “MAP” button along the right hand side. [Keep in in mind any hidden Caster Table entries are not part of the returned table and will not be shown]
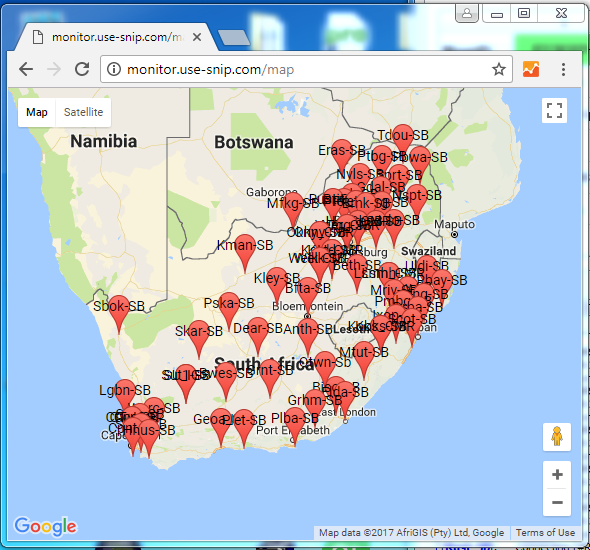
The resulting maps displayed are somewhat similar. The normal legend is removed and they can be panned and zoomed in the normal way. Below is an example showing the Monitor Tool’s plot of the South African TRIGnet CORS network.
For further details on using the monitor tool to decode common Caster Tables, try here.

